

Offline plotting and analysis are critical aspects of many engineering and scientific studies. Having the right tool to quickly and efficiently view, analyze, and modify large quantities of data is equally important.
Process Data Quickly and Efficiently
Enerplot™ is a fully automatable application that allows you to perform highly repetitive tasks at lightning speed. You can write scripts using the embedded Python interface or record your actions to create custom script macros.
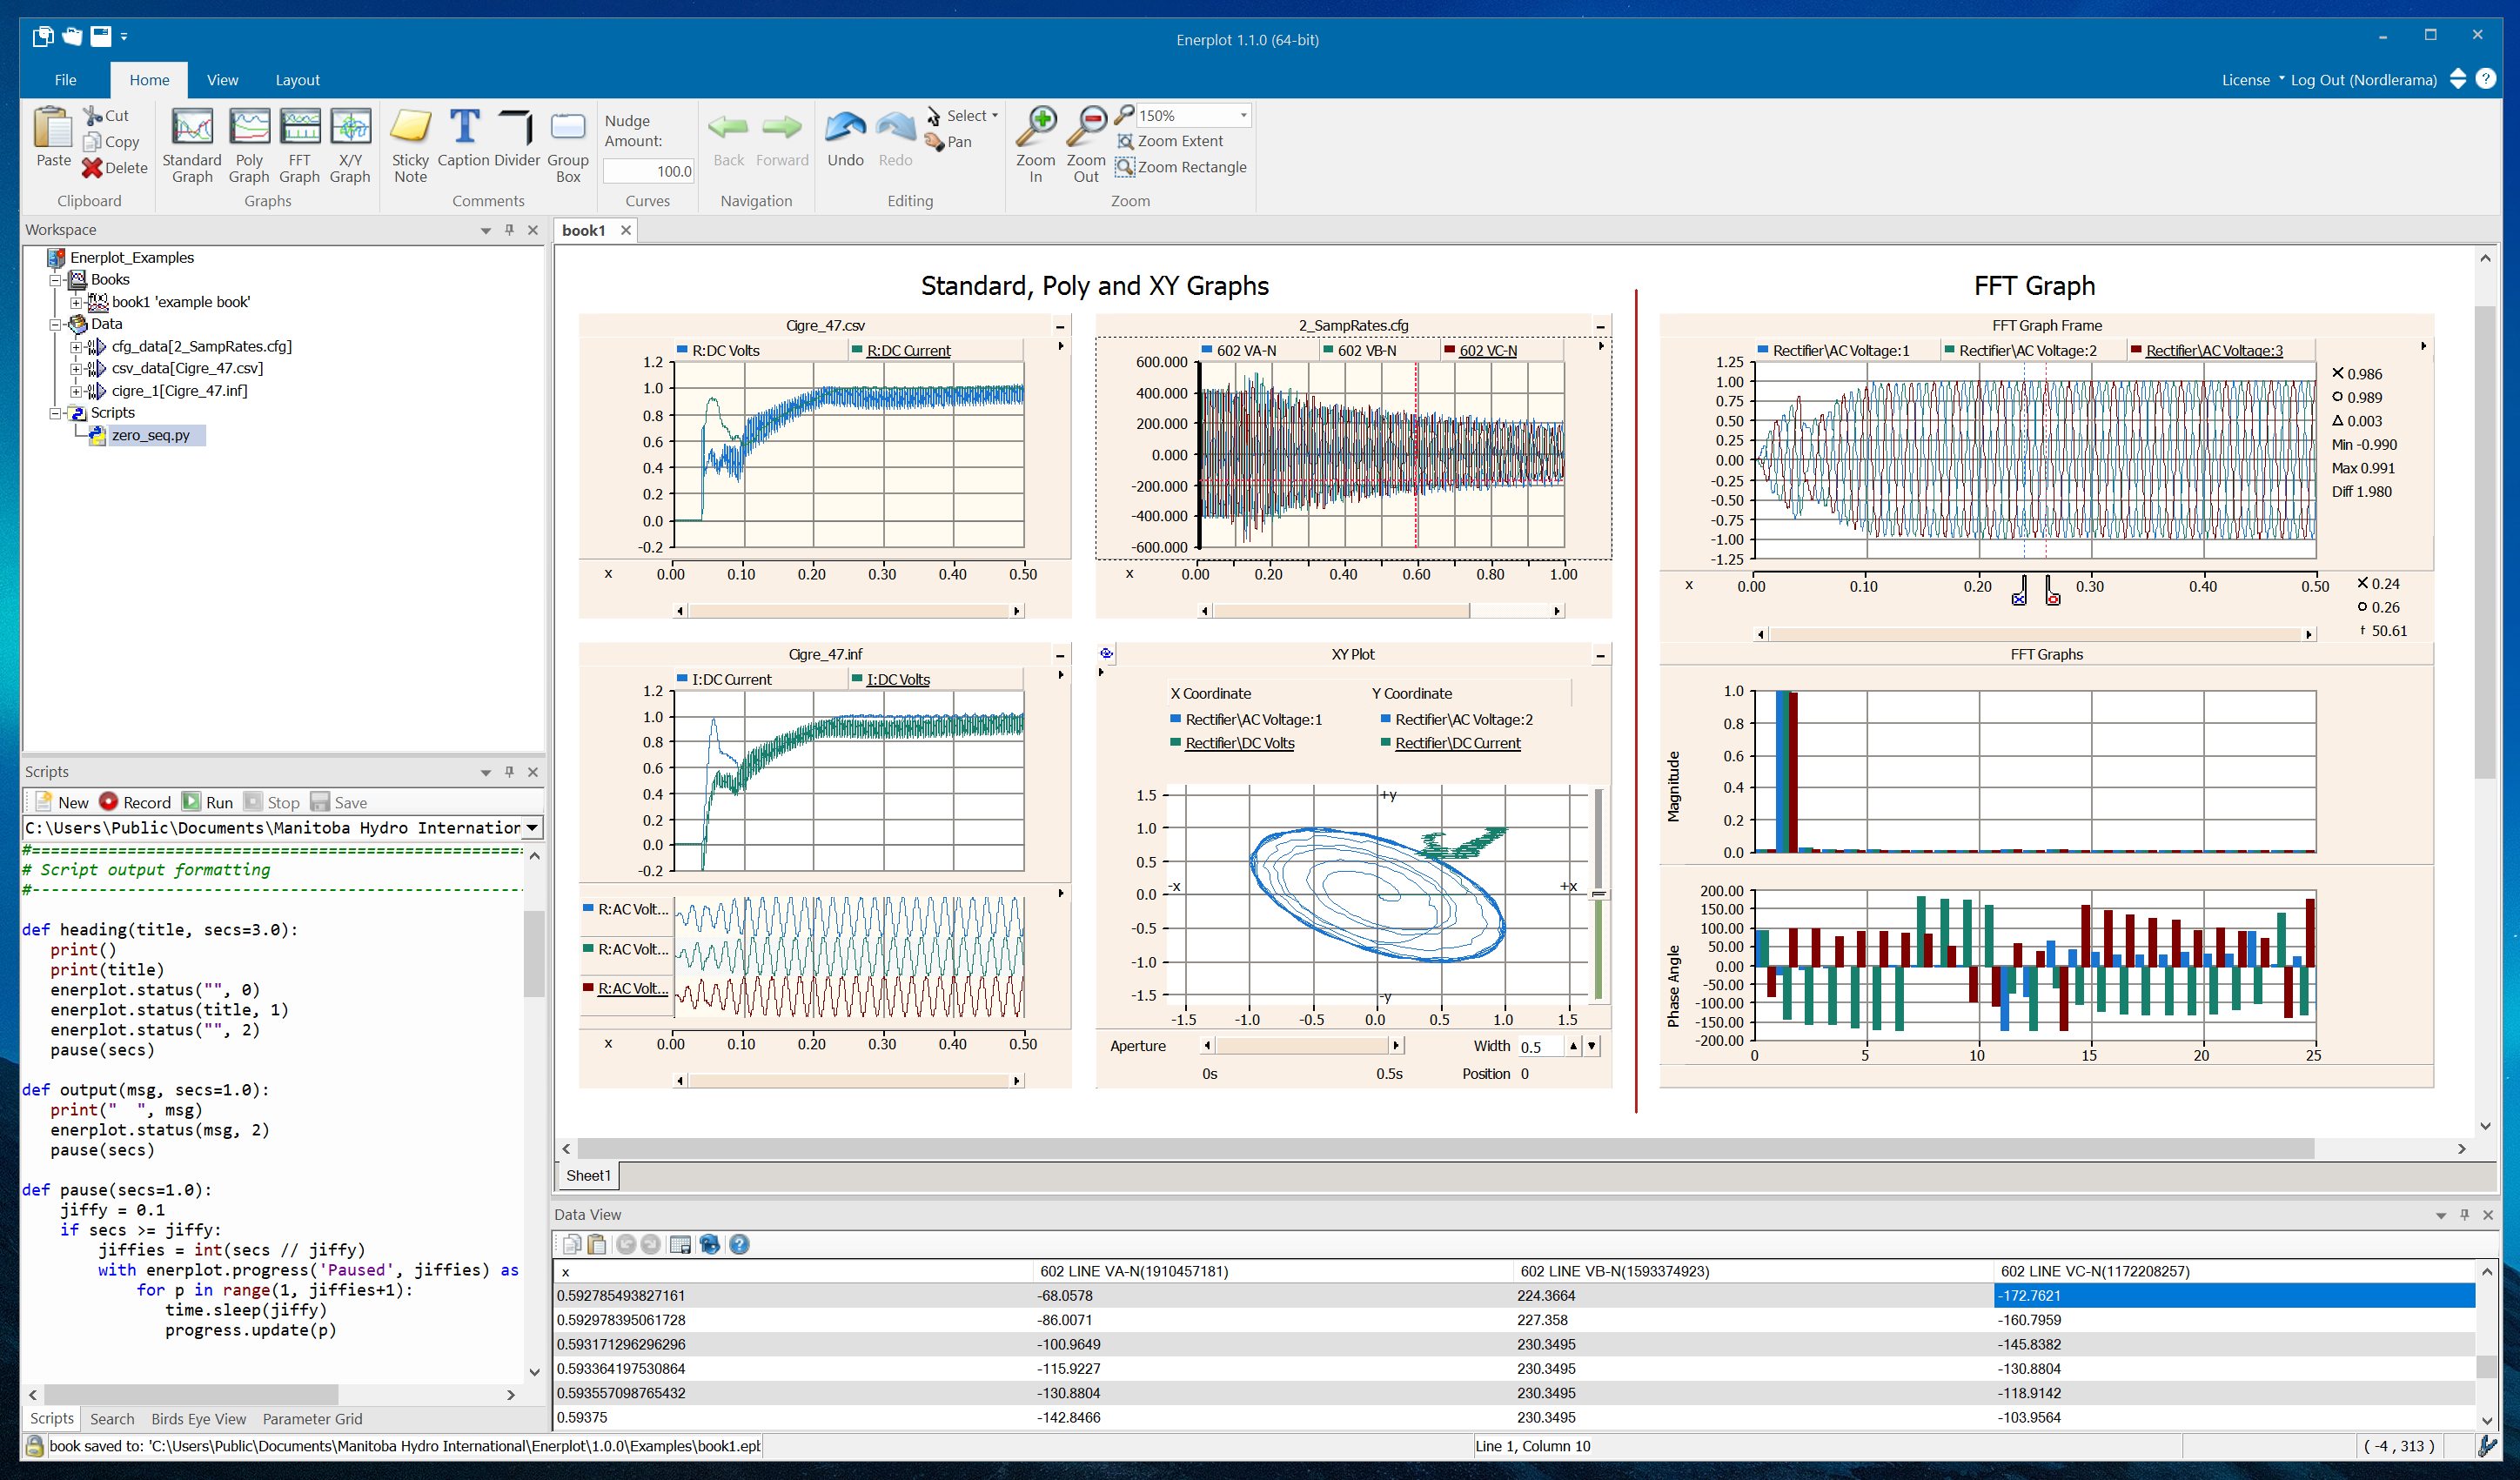
Application-level functions include loading data, creating graphs, and generating curves. Additionally, Enerplot’s Python math library allows you to create custom curves.
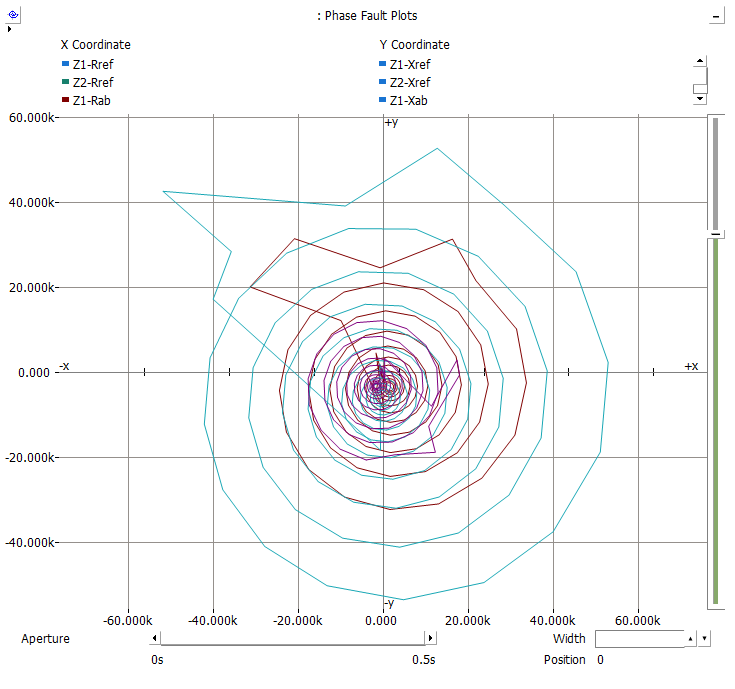
Instantaneous phase impedance compared to pre-defined Mho circles
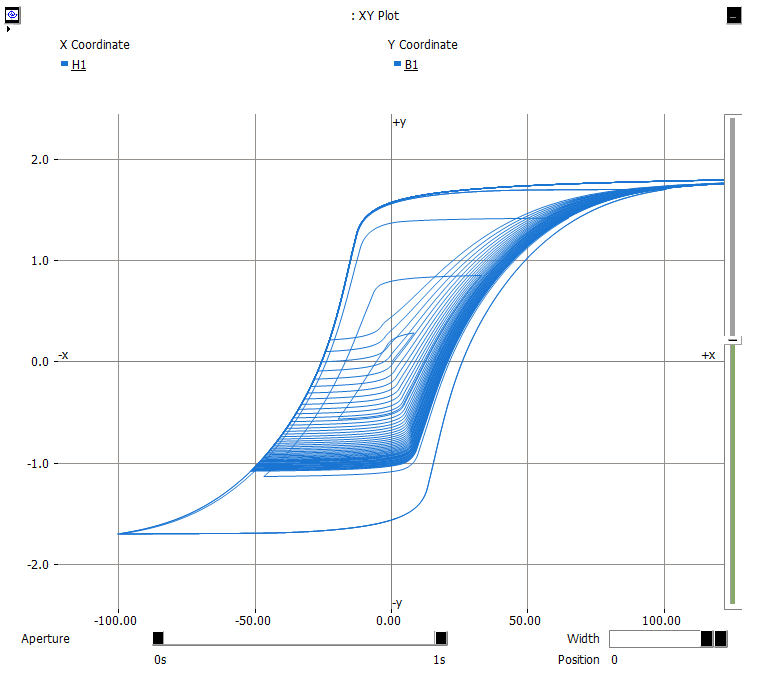
Transformer core flux density vs. magnetic field intensity
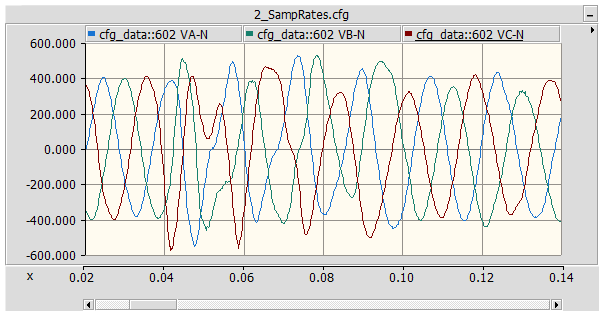
Three-phase voltage transient
Enerplot Supports the Import of Data in Many Formats:
- PSCAD™/EMTDC™ output (*.inf, *.out, *.psout);
- PSCAD™ Harmonic Frequency Scanner output files;
- COMTRADE (*.cfg) – 1991, 1999 both ASCII and binary;
- PSS/E (*.out, *.asc) (licensed by Siemens);
- GE PSLF (*.acf and *.chf) (licensed by General Electric Company)
- RSCAD (*.out) (RTDS Technologies);
- DCLFL (*.ana) (DC Line Fault Locator licensed by MHI, Ltd.)
- Comma Separated Values (*.csv) – formatted and unformatted;
- Text Files (*.txt) – formatted and unformatted.
Datasets sourced and loaded from any of the supported types above can be converted and saved as either COMTRADE or Comma Separated Variable (*.csv) format.
Features and Benefits Include:
- Automated scripting with embedded Python interface;
- The ability to create custom scripts by recording user actions;
- Speed optimized loading allows for huge amounts of data to be loaded in seconds
- Powerful, embedded math parser for creating and modifying new and pre-existing curves;
- Fast-Fourier Transform (FFT) analysis tools;
- Saving time with the ability to template projects when performing similar studies;
- Quickly switching between curves by toggling references and loaded datasets;
- Easily shifting, scaling, smoothing, and manually adjusting curves;
- Option to update graphs using data file change detection.
Contact us for more information and pricing.